Blue-Green Deployment with Nginx and Real-Time Monitoring
A production-ready blue-green deployment system with automatic failover, real-time error detection, and Slack alerting.
Blue-Green Deployment with Nginx and Real-Time Monitoring
As part of my DevOps journey, I set out to build a Blue-Green Nginx deployment system that could automatically detect failures, switch between application pools, and alert me in real-time when things went wrong. The goal was to understand zero-downtime deployments at a practical level while building something that could catch issues before users noticed.
This project combines Docker orchestration, Nginx reverse proxy configuration, Python log analysis, and Slack integration to create a complete monitoring and deployment solution. Along the way, I learned about Docker volume sharing, structured logging, and the surprising complexity of making containers talk to each other reliably.
What it does
The system runs four Docker containers that work together:
- Nginx reverse proxy: Routes traffic to blue or green application pools with automatic failover
- Blue application pool: Primary or backup application instance
- Green application pool: Primary or backup application instance
- Alert watcher: Monitors Nginx logs in real-time and sends alerts to Slack
Key features:
- Automatic failover from primary to backup pool when the primary becomes unhealthy
- Real-time error rate monitoring with configurable thresholds
- Structured JSON logging capturing pool name, release ID, latency, and upstream status
- Slack notifications for high error rates and pool failover events
- Tight timeouts and retry logic for fast failure detection
- Comprehensive health checks for all services
- Zero-downtime switching between blue and green pools
Architecture at a glance
                        ┌─────────────────┐
                        │   Nginx Proxy   │
                        │   (Port 80)     │
                        └────────┬────────┘
                                 │
                    ┌────────────┴────────────┐
                    │                         │
          ┌─────────▼──────────┐   ┌─────────▼──────────┐
          │   Blue Pool        │   │   Green Pool       │
          │   (Primary/Backup) │   │   (Backup/Primary) │
          │   Port 3000        │   │   Port 3000        │
          └────────────────────┘   └────────────────────┘

                    ┌────────────────────────┐
                    │   Alert Watcher        │
                    │   (Monitors Logs)      │
                    └───────────┬────────────┘
                                │
                                ▼
                        ┌───────────────┐
                        │     Slack     │
                        └───────────────┘
The Nginx proxy determines which pool is primary based on the ACTIVE_POOL environment variable. It routes all traffic to the primary pool and only fails over to the backup when it detects errors. The alert watcher continuously tails the Nginx access logs and calculates error rates over a sliding window.
How it works step by step
1. Dynamic Nginx configuration
The Nginx container uses a custom entrypoint script that generates the reverse proxy configuration dynamically based on environment variables. This approach lets me switch the active pool without rebuilding the image.
The entrypoint script:
#!/bin/sh
set -e

# Determine primary and backup based on active pool
if [ "$ACTIVE_POOL" = "blue" ]; then
    PRIMARY="app_blue"
    BACKUP="app_green"
else
    PRIMARY="app_green"
    BACKUP="app_blue"
fi

# Generate nginx configuration
cat > /etc/nginx/conf.d/default.conf <<EOF
log_format detailed_json escape=json '{'
    '"time_local":"\$time_local",'
    '"remote_addr":"\$remote_addr",'
    '"request":"\$request",'
    '"status":\$status,'
    '"upstream_status":"\$upstream_status",'
    '"pool":"\$upstream_http_x_app_pool",'
    '"release":"\$upstream_http_x_release_id"'
'}';

upstream backend {
    server ${PRIMARY}:${PORT} max_fails=1 fail_timeout=10s;
    server ${BACKUP}:${PORT} backup max_fails=1 fail_timeout=10s;
}

server {
    listen 80;
    access_log /var/log/nginx/access.log detailed_json;

    location / {
        proxy_pass http://backend;
        proxy_next_upstream error timeout http_500 http_502 http_503 http_504;
        proxy_connect_timeout 2s;
        proxy_read_timeout 3s;
    }
}
EOF

# Create real log files instead of symlinks
rm -f /var/log/nginx/access.log /var/log/nginx/error.log
touch /var/log/nginx/access.log /var/log/nginx/error.log

exec nginx -g 'daemon off;'
The critical pieces here:
max_fails=1marks the server as down after just one failed health checkbackupdirective ensures the backup only receives traffic when the primary fails- Tight timeouts (2-3 seconds) enable fast failure detection
proxy_next_upstreamautomatically retries failed requests on the backup pool- JSON log format captures structured data for analysis
2. Structured logging
The JSON log format captures everything I need to monitor the system:
{
  "time_local": "30/Oct/2025:15:23:34 +0000",
  "remote_addr": "172.18.0.1",
  "request": "GET / HTTP/1.1",
  "status": 502,
  "upstream_status": "502",
  "pool": "blue",
  "release": "v1.0.0"
}
This structured format makes it trivial to parse logs in Python and calculate metrics. I can see exactly which pool handled each request, what the response time was, and whether it succeeded or failed.
3. Real-time log monitoring
The alert watcher is a Python service that tails the Nginx access log and analyzes it in real-time. It uses a sliding window to calculate error rates and detects when the active pool changes.
Core monitoring logic:
def tail_log_file(file_path):
    with open(file_path, 'r') as f:
        f.read()  # Skip to end of file
        while True:
            line = f.readline()
            if line:
                try:
                    log_entry = json.loads(line)
                    request_window.append(log_entry)

                    # Keep only recent requests in window
                    if len(request_window) > WINDOW_SIZE:
                        request_window.popleft()

                    check_error_rate()
                    check_failover(log_entry.get('pool'))
                except json.JSONDecodeError:
                    continue
            time.sleep(0.1)
The sliding window approach is critical. Instead of looking at all historical requests, I only consider the last N requests (configurable, default 200). This makes the monitoring responsive to sudden spikes while filtering out noise from historical data.
Error rate calculation:
def check_error_rate():
    if len(request_window) < WINDOW_SIZE:
        return

    error_count = sum(1 for req in request_window
                     if str(req.get('status', '')).startswith(('5', '4')))
    error_rate = (error_count / len(request_window)) * 100

    if error_rate > ERROR_RATE_THRESHOLD:
        send_slack_alert('high_error_rate', error_rate)
4. Slack alerting
When the watcher detects an issue, it posts to Slack using an incoming webhook. I set up two alert types:
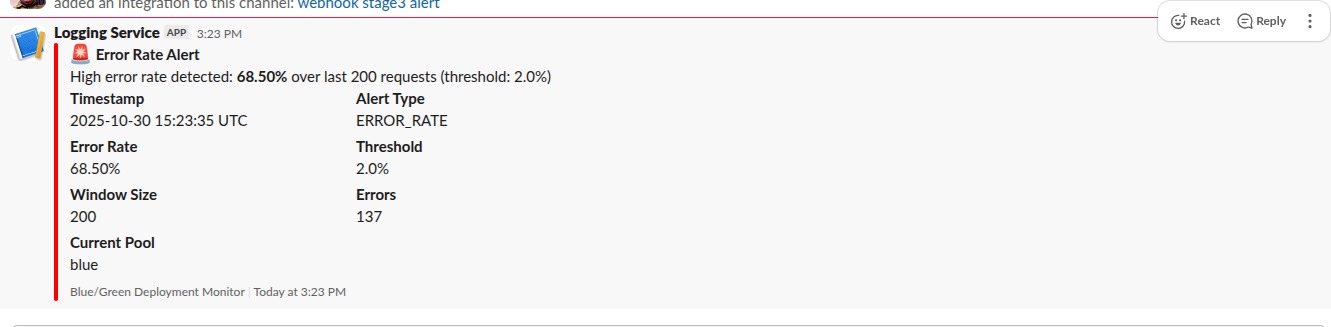
High Error Rate Alert:
Alert: High Error Rate Detected
Error Rate: 69.0%
Threshold: 2.0%
Window Size: 200 requests
Time: 2025-10-30 15:23:35
Action Required: Check application logs and service health
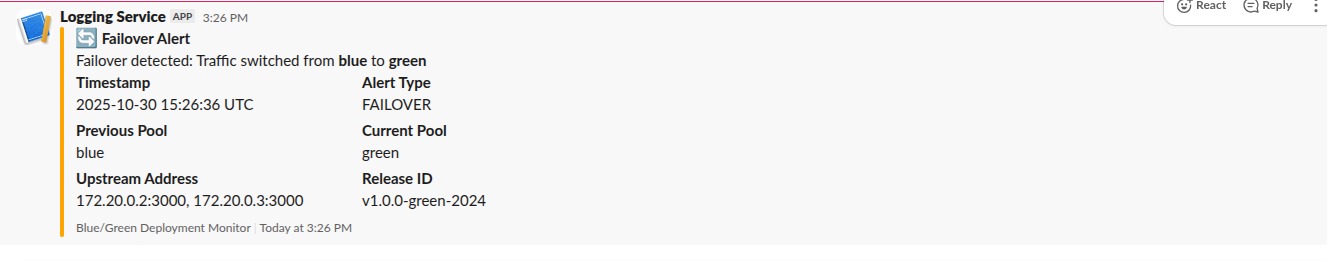
Pool Failover Alert:
Alert: Pool Failover Detected
Previous Pool: blue
Current Pool: green
Time: 2025-10-30 15:26:37
Action Required: Investigate why primary pool failed
The alerting includes a cooldown mechanism to prevent alert flooding. Once an alert fires, it will not fire again for a configurable period (default 300 seconds), even if the condition persists.
Alert cooldown logic:
def send_slack_alert(alert_type, data):
    current_time = time.time()
    if alert_type in last_alert_time:
        time_since_last = current_time - last_alert_time[alert_type]
        if time_since_last < ALERT_COOLDOWN_SEC:
            return

    # Send to Slack
    requests.post(SLACK_WEBHOOK_URL, json=payload)
    last_alert_time[alert_type] = current_time
5. Docker orchestration
The entire system runs through Docker Compose with proper health checks and dependencies:
services:
  nginx:
    image: nginx:alpine
    container_name: nginx_proxy
    ports:
      - 8080:80
    volumes:
      - ./nginx/entrypoint.sh:/docker-entrypoint.sh:ro
      - nginx_logs:/var/log/nginx
    environment:
      - ACTIVE_POOL=${ACTIVE_POOL}
      - PORT=${PORT:-3000}
    depends_on:
      app_blue:
        condition: service_healthy
      app_green:
        condition: service_healthy
    healthcheck:
      test: ["CMD-SHELL", "curl -f http://localhost:80/nginx-health || exit 1"]
      interval: 10s
      timeout: 5s
      retries: 3
    networks:
      - app-network
    restart: unless-stopped

  app_blue:
    image: ${BLUE_IMAGE}
    container_name: app_blue
    environment:
      - APP_POOL=blue
      - RELEASE_ID=${RELEASE_ID_BLUE}
      - PORT=${PORT:-3000}
    ports:
      - "8081:${PORT:-3000}"
    healthcheck:
      test: ["CMD-SHELL", "wget --no-verbose --tries=1 --spider http://localhost:${PORT:-3000}/healthz || exit 1"]
      interval: 5s
      timeout: 3s
      retries: 3
      start_period: 10s
    networks:
      - app-network
    restart: unless-stopped

  app_green:
    image: ${GREEN_IMAGE}
    container_name: app_green
    environment:
      - APP_POOL=green
      - RELEASE_ID=${RELEASE_ID_GREEN}
      - PORT=${PORT:-3000}
    ports:
      - "8082:${PORT:-3000}"
    healthcheck:
      test: ["CMD-SHELL", "wget --no-verbose --tries=1 --spider http://localhost:${PORT:-3000}/healthz || exit 1"]
      interval: 5s
      timeout: 3s
      retries: 3
      start_period: 10s
    networks:
      - app-network
    restart: unless-stopped

  alert_watcher:
    build:
      context: ./watcher
      dockerfile: Dockerfile
    container_name: alert_watcher
    volumes:
      - nginx_logs:/var/log/nginx:ro
    environment:
      - SLACK_WEBHOOK_URL=${SLACK_WEBHOOK_URL}
      - ERROR_RATE_THRESHOLD=${ERROR_RATE_THRESHOLD:-0.05}
      - WINDOW_SIZE=${WINDOW_SIZE:-5}
      - ALERT_COOLDOWN_SEC=${ALERT_COOLDOWN_SEC:-300}
      - MAINTENANCE_MODE=${MAINTENANCE_MODE:-false}
    depends_on:
      nginx:
        condition: service_healthy
    networks:
      - app-network
    restart: unless-stopped

networks:
  app-network:
    driver: bridge
    name: bluegreen_network

volumes:
  nginx_logs:
    driver: local
The key architectural decisions:
- Pre-built Docker images: Blue and green pools use existing Docker images (specified via
BLUE_IMAGEandGREEN_IMAGEenvironment variables), making deployments fast and version-controlled - Shared volume (
nginx_logs): Lets the watcher read Nginx logs in real-time - Comprehensive health checks: Each service has detailed health checks with retries and timeouts to ensure reliability
- Read-only mount (
:ro): For the watcher prevents accidental log corruption - Explicit dependency chain: Nginx waits for both app pools to be healthy; watcher waits for nginx
- Direct port mapping: Blue (8081) and green (8082) pools are accessible directly for debugging, while nginx exposes port 8080 for production traffic
- Restart policies: All services use
unless-stoppedto survive host reboots - Custom network: Isolated bridge network for container-to-container communication
Testing the system
I wrote a comprehensive test script that validates all the key behaviors:
#!/bin/bash

echo "=== Phase 1: Health Checks ==="
curl http://localhost/nginx-health
docker compose ps

echo "=== Phase 2: Generate Baseline Traffic ==="
for i in {1..50}; do
  curl -s http://localhost/ > /dev/null
done

echo "=== Phase 3: Trigger Failover ==="
docker compose stop app_blue
for i in {1..30}; do
  curl -s http://localhost/ > /dev/null
done

echo "=== Phase 4: Trigger High Error Rate Alert ==="
for i in {1..150}; do
  curl -s --max-time 5 http://localhost/nonexistent > /dev/null 2>&1
done

echo "=== Phase 5: Check Logs ==="
docker compose logs nginx | tail -20
docker compose logs alert_watcher | tail -20

echo "=== Phase 6: Verify Slack Notifications ==="
echo "Check your Slack channel for two alerts:"
echo "1. High error rate alert (should show ~69% error rate)"
echo "2. Pool failover alert (blue -> green)"
This script systematically tests:
- All services are healthy
- Normal traffic routes correctly
- Automatic failover when primary pool fails
- Error rate detection and alerting
- Log structure and content
- End-to-end Slack integration
Challenges I hit (and what I learned)
1. Volume mounting syntax
I initially used nginx.ro instead of nginx:ro for the read-only volume mount. This created a new volume called nginx.ro instead of mounting nginx as read-only. The watcher couldn't find the log files.
Fix: Use proper volume mount syntax with colon separator. Read the Docker documentation more carefully.
2. Nginx log files as symlinks
By default, Nginx creates /var/log/nginx/access.log as a symlink to /dev/stdout. When I tried to tail this file in Python, I got "underlying stream is not seekable" errors.
Fix: In the entrypoint script, remove the symlinks and create real files:
rm -f /var/log/nginx/access.log /var/log/nginx/error.log
touch /var/log/nginx/access.log /var/log/nginx/error.log
This was not obvious. I spent a while debugging file permissions before realizing the issue was the symlink itself.
3. Python file seeking
I originally tried f.seek(0, 2) to jump to the end of the log file. This worked for regular files but failed on Docker volumes with a "not seekable" error.
Fix: Use f.read() to consume existing content instead of seeking. This works on all file types:
with open(file_path, 'r') as f:
    f.read()  # Consume existing content
    while True:
        line = f.readline()
        # Process new lines
4. Webhook URL not updating
After updating the webhook URL in my .env file, the watcher kept using the old URL. This was because Docker Compose only reads environment variables when creating containers, not when starting them.
Fix: Recreate the container to pick up new environment variables:
docker compose up -d --force-recreate alert_watcher
Or just rebuild everything:
docker compose down
docker compose up -d
5. Not enough errors to trigger alert
With a 2% threshold and 200-request window, I needed at least 4 errors to trigger an alert. Sending just a handful of bad requests was not enough.
Fix: Send 150+ error requests to ensure the sliding window fills with enough errors:
for i in {1..150}; do
  curl -s http://localhost/nonexistent > /dev/null 2>&1
done
Understanding the math here was important. Threshold × Window Size = Minimum Errors.
6. Alert flooding
During testing, I generated so many errors that Slack was getting spammed with repeated alerts every few seconds.No
Fix: Implement cooldown logic so each alert type can only fire once every 5 minutes:
ALERT_COOLDOWN_SEC = 300
last_alert_time = {}No

def send_slack_alert(alert_type, data):
    if alert_type in last_alert_time:
        if time.time() - last_alert_time[alert_type] < ALERT_COOLDOWN_SEC:
            return
    # Send alert
    last_alert_time[alert_type] = time.time()
Configuration options
Everything is configurable through environment variables:
| Variable | Default | Purpose |
|---|---|---|
ACTIVE_POOL | blue | Which pool is primary (blue or green) |
PORT | 3000 | Application container port |
ERROR_RATE_THRESHOLD | 2 | Error rate percentage that triggers alert |
WINDOW_SIZE | 200 | Number of recent requests to analyze |
ALERT_COOLDOWN_SEC | 300 | Seconds between repeated alerts |
SLACK_WEBHOOK_URL | (required) | Slack incoming webhook for alerts |
To switch the active pool:
# Edit docker-compose.yml or .env
ACTIVE_POOL=green

# Recreate nginx to apply new config
docker compose up -d --force-recreate nginx
To adjust error sensitivity:
# More sensitive (alert on 1% errors)
ERROR_RATE_THRESHOLD=1

# Less sensitive (alert on 5% errors)
ERROR_RATE_THRESHOLD=5
What I would add next
- Automated testing in CI/CD: Run the test script as part of a GitHub Actions workflow
- Metrics persistence: Store error rates and failover events in a time-series database
- Graceful shutdown: Drain connections from the old pool before switching
- Canary deployments: Route a small percentage of traffic to the new version before fully switching
- Multiple environment support: Dev, staging, and production configurations
- Prometheus integration: Export metrics for long-term analysis and dashboarding
- Automatic rollback: If error rate spikes after a pool switch, automatically roll back
Closing thoughts
This project taught me that zero-downtime deployments are more than just running two copies of your app. The real challenge is in the monitoring, the failure detection speed, and the operational visibility.
The blue-green pattern is elegant in theory but requires careful orchestration in practice. Docker Compose made it manageable, but I still had to work through volume mounting issues, log file quirks, and the surprising complexity of getting containers to share data reliably.
The most valuable lesson was understanding the sliding window approach to error rate monitoring. It is responsive enough to catch sudden spikes but stable enough to avoid false positives from transient errors. The cooldown mechanism prevents alert fatigue while still catching persistent issues.
If you are learning DevOps, I recommend building something like this. It covers Docker networking, reverse proxies, structured logging, real-time data processing, and external integrations. Each piece is simple, but putting them together reveals the operational complexity of production systems.